Reflect: Review the artifacts above on student enrollments and student progress in the course.
Answer: How might the teacher adjust the course in the future based on the previous activity of these students? What uses does data have for online instruction? What advantages do teachers who utilize data have over those that do not?
An instructor can adjust a course based on many factors. A teacher can change the course based on data by omitting or changing the lesson that had the least amount of completion. Also, an instructor can look at assessments that had low scores and changes by rephrasing of sentences, or lessons can be better laid out in order for students to retain information. Data gives the teacher concrete evidence of student and class performance; the teacher can see how a student does over time or even look at how students use a particular tool. Teachers who utilize data have many more advantages than those who do not, teachers are able to offer better feedback to students, give students a more personalized learning experience and can become a better teacher.
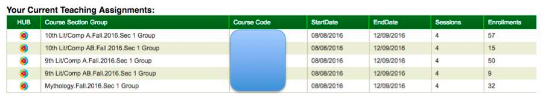
According to the data table both 9th and 10th grade AB Fall classes have low enrollment, while those only in A Fall have a high enrollment. The teacher will have to take into consideration the number of students alone. Those with a high volume of students may end up taking more time i.e. grading assessment and assignments and may prove to be difficult to have collaboration among the students and provide a classroom setting in a digital world. The teacher could try to make more sections of the A Fall courses to help facilitate online collaboration. In this table, the data provides the teacher with the knowledge to provide feedback to administrators who make the sections and provide feedback to create smaller sections. If the teacher uses this chart along with other data showing student completion of assessments, classwork etc. it may persuade administrators to create more courses. Data never lies and helps a teacher provide a better education to students. A smaller course will create a more collaborative classroom environment.
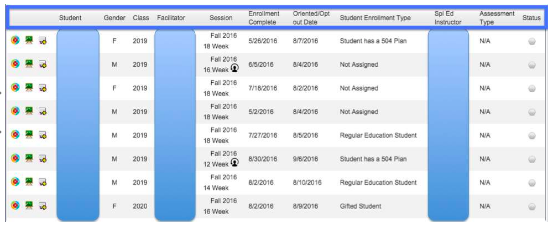
This data tells the teacher what kind of accommodations students have, as well as how long they are enrolled in the course. The teacher can see the data of all 12 week, 14 week, 16 week and 18 week long enrolled students and see if assignments are completed among these groups of students. There may be a difference in how an assignment is completed and the teacher can then make adjustments to any assignments to better differentiate. The teacher should then separate the data of students who have accommodations and see if they completed assignments. If those students were not able to complete the assignment to expectations perhaps the teacher needs to look at delivery and other methods to help those students achieve the expectations of assignments. Teachers that use data, like this chart have an advantage over others that don’t because they will be able to better accommodate all students and make their learning experience better.
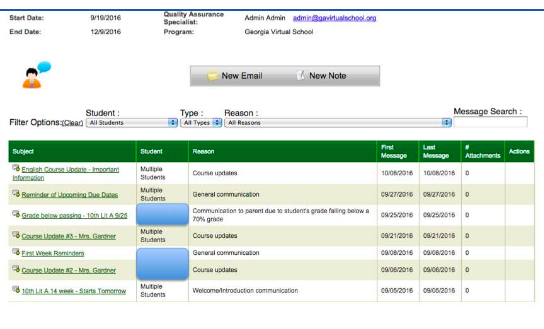
This data shows a teacher how to adjust a course by looking back and through communication and seeing if the student passed the course. If the teacher sees a correlation between not passing/barely passing and the first communication, the teacher can adjust the timing of the first communication of grade below 70%. According to the table the class began on 9/5 and communication of course failure was 20 days afterwards. (3 weeks in). If the teacher finds a correlation between this communication and failure rates of those same students the teacher should adjust first communication as soon as the student falls before 70% or is showing a trend/pattern of failure. When teachers use data like the above chart to guide instruction, they have distinct advantage over teachers who do not because they are able to make their teaching and communication better, which can then lead to higher pass rate (more learning) in the course(s).
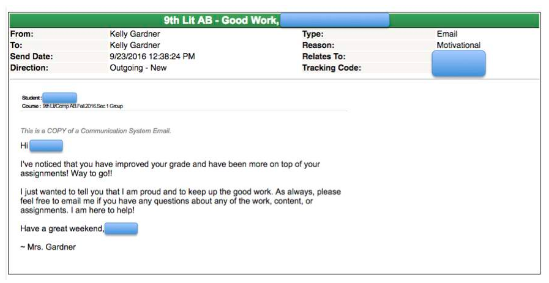
This is a motivational email to a student that perhaps was failing in the course but is now doing a good job. This is a great tool to say to a student I see your hard work and keep it up. The teacher will be able to see a direct correlation between motivational email communication and passing the course. Teachers who utilize data to drive instruction have a distinct advantage over those who do not because they can make changes to their course and communication in order to increase student achievement.
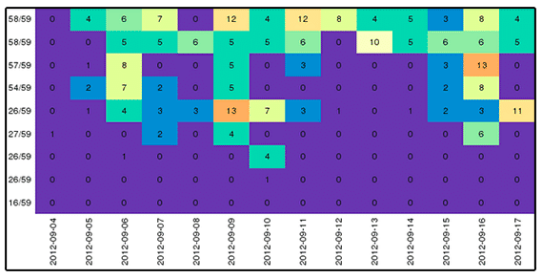
This chart gives information on how many assignments students have completed and how many tools they have used for a particular assignment. The teacher can use this data for future course by seeing how many tools were used and which ones were not. For example, For the first assignment, the tool(s) provided were not used at all. This data would tell the teacher to re-evaluate the assignment and the tool(s); are the tools useful to the assignment? Do the students need to use the tool? The teacher can also see the correlation between the grade on an assignment and tool usage; if a student can do well with out using a tool, then the tool is not useful and teacher needs to reevaluate both the assignment and tools. This data is very useful in online instruction because the teacher can have an up to date understanding why a student is doing well or not doing well in the course; the teacher would be able to provide proper feedback to each student based on this data. A teacher who uses this data has a distinct advantage over teachers who do not because they will be able to communicate better with parents and students, as well as make changes to assignment and tools to make the course better.
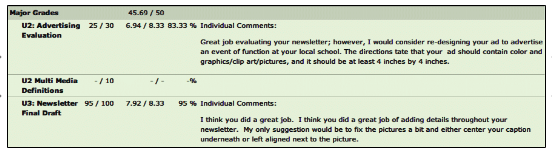
The teacher would need to look at all the feedback given to students. For example, for U3 Newsletter Final Draft, the teacher comments on what was missing for the newsletter ( Center captions and left align pictures). It would be necessary for the teacher to look at all feedback because if there are many students who did the same thing than the teacher missed a lesson on showing that skill or needs to improve the delivery of the lesson that teaches students that skill, perhaps even give them a small formative to show they are able to do it correctly. This data is useful in online instruction for several reasons, the first is that it provides students a way to see feedback from the teacher and how to improve on future assignments. The second this allows the teacher to collect all feedback given to students and see if there are any correlations, or skills that all/ most students missed. If so, then the teacher can make improvements on the lesson. A teacher who uses this data has a distinct advantage over teachers who do not because they will be able to see where students have gotten the skill and where they have not, this will allow the teacher to adjust lessons for future students.
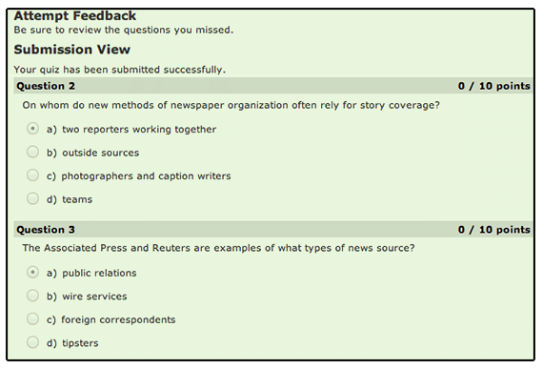
The data above shows the questions missed by a particular student. However, it does not show any links or tools to help students know which one is the correct answer. The teacher can make improvements based on this data by looking at all students and seeing which questions were commonly missed within a certain threshold. If there are common questions missed then the teacher needs to look back at the lessons in which the standard is covered and redesign the lesson so that students can obtain the knowledge necessary. Also, I wonder if students are able to retake quizzes as a way to facilitate Growth Mindset and the concept of Try Again. This data is useful for online instruction because it allows the teacher to see which students are passing quizzes and which are not, what concepts are being learned and which ones are not. This data will allow the teacher to come up with a reteaching moment (Review) for those students who did not get the concepts the first time around. A teacher who uses this data has a distinct advantage over teachers who do not because they will be able to help students reach their learning goals better. Using the data above will also allow students to know which learning goals they have reached and which ones they have missed.
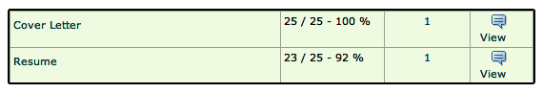
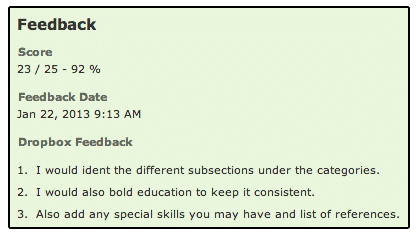
This student was able to get full credit for the cover letter but missed a few points on the resume portion because of aesthetics and missing portions (skills and references) The teacher can see how many students made the same mistake; if there were many students with the same mistakes the teacher should re-evaluate the lessons leading up this and even the rubric so that students know what the expectations are. Also, I am wondering if the teacher allows the student to fix what they missed and receive a portion of the points back as, learning how to create a good resume is the goal here. This data is useful in driving instruction because the teacher may see that students missed the same requirements and this would prove to be a re-teachable moment for the students. Teachers who use this data have a distinct advantage over those who don’t because this data gives great student feedback which allows them to take control of their learning. With the feedback given students understand where they went right and where they went wrong. Teachers can also use the feedback of all the students to see if there is any correlation between tasks missed between all of them and re-evaluate the lesson/rubric and other tools that go with the assignment.
